What Is Gross Rent Multiplier in Real Estate?
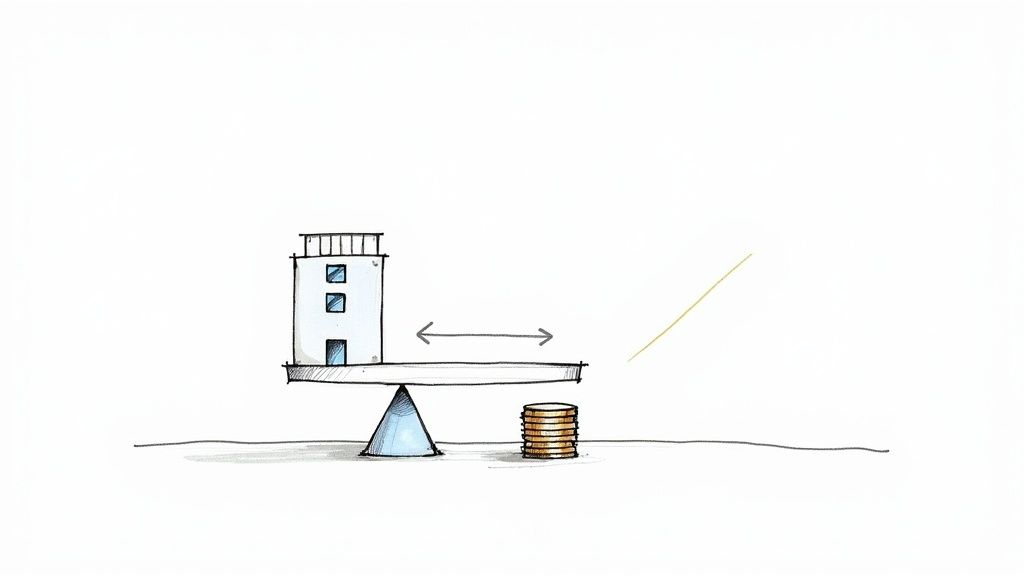
When you're sorting through multifamily deals, you need a quick way to separate the contenders from the pretenders. Enter the Gross Rent Multiplier, or GRM. It's a simple, back of the napkin calculation that gives you a first glance at a property's value relative to the money it brings in.
Think of it as a sanity check. Before you spend hours or days deep in a complex underwriting model, the GRM tells you if a property is even in the right ballpark.
Your First Look at Gross Rent Multiplier
Let's get straight to it. The Gross Rent Multiplier is the multifamily investor's go to tool for a quick gut check. It’s like glancing at a car's price based on its mileage before you pop the hood. For seasoned pros, it's the very first filter used to decide if a potential deal is worth a second look.
This metric is most useful when you’re facing a pipeline full of potential acquisitions. Instead of getting stuck in detailed spreadsheets for every single property, you can use the GRM to rapidly screen dozens of opportunities. It helps you focus your time and energy on the deals that actually have a shot. If you want a deeper look, this is a great primer on what is Gross Rent Multiplier for investors.
The Simple Formula in Action
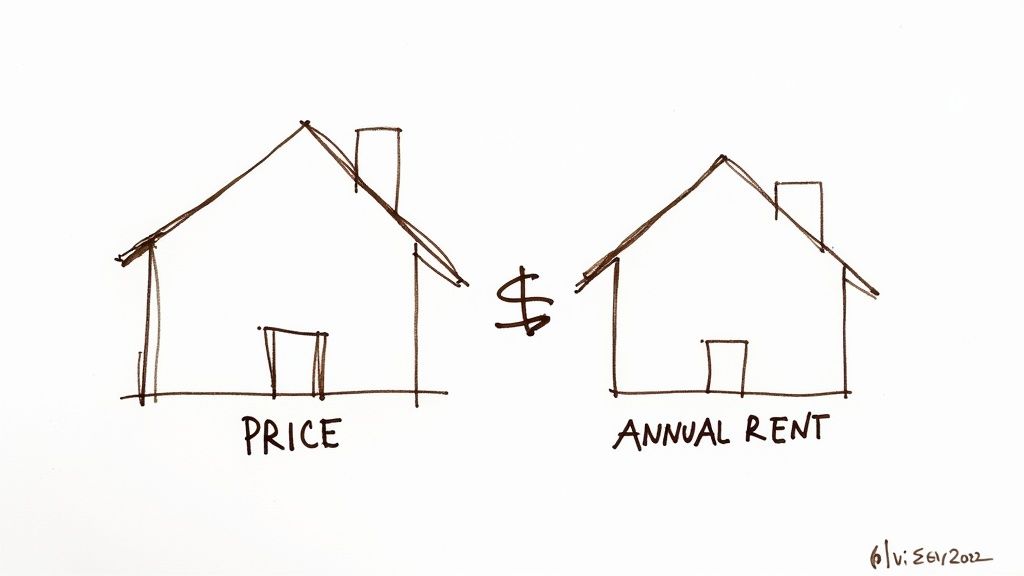
At its heart, the GRM formula is refreshingly simple. No complex math needed.
Property Price ÷ Gross Annual Rent = Gross Rent Multiplier (GRM)
This little number tells you how many years it would take for the property's gross rental income to completely pay for its purchase price.
Let's use a practical example. Say you're looking at an apartment building listed for $1,000,000 that pulls in $100,000 in gross rent each year.
- $1,000,000 (Price) ÷ $100,000 (Gross Rent) = 10 GRM
That "10" means, in a world with no expenses, it would take a decade of collecting rent to cover the initial purchase price. Simple.
What GRM Tells You Instantly
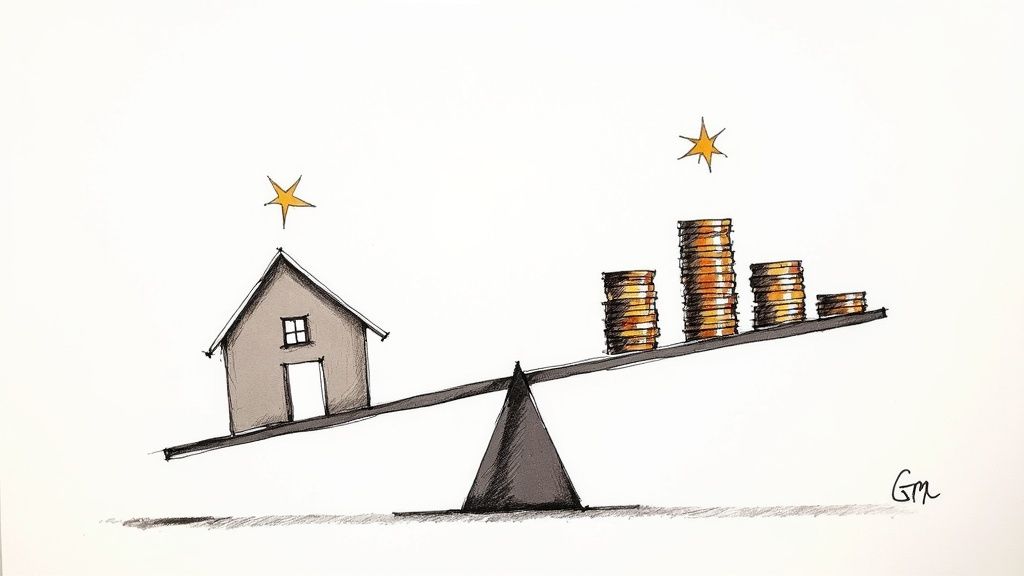
So, what does that number actually signal? A lower GRM often suggests a property might be a better value, since its price is lower in proportion to its income. On the other hand, a higher GRM could mean the property is on the pricier side for the cash it generates.
The true power of the GRM is its speed. When a broker sends over a fresh offering memorandum, you can calculate the GRM in about 30 seconds flat. This immediate insight lets you compare the new property to others in your target market, helping you instantly see if it's priced competitively or if the seller is dreaming.
To make it even clearer, let's break down the components.
Gross Rent Multiplier At a Glance
This table breaks down the core components of the GRM formula and what each part represents in a real estate deal.
| Component | What It Means | Example Value |
|---|---|---|
| Property Price | The total acquisition cost or market value of the property. | $1,000,000 |
| Gross Annual Rent | The total rental income collected in one year, before any expenses are deducted. | $100,000 |
| GRM | The resulting multiplier, indicating the relationship between price and gross income. | 10 |
This simple breakdown shows how the inputs directly create the output, giving you a quick measure of value.
Ultimately, the GRM isn't the final word on an investment, but it’s the perfect conversation starter. It’s a high level view that tells you if a deal is worth your time before you get lost in the details of operating expenses and net income. By mastering this first step, you can build a more efficient deal flow and pounce on the best opportunities faster than the competition.
Calculating GRM with Real World Numbers
Alright, let's move past the theory and put the Gross Rent Multiplier formula to work. This is where you see how a simple metric can give you a powerful first look at a deal. The math itself is dead simple, but the whole thing depends on getting your inputs right.
Let's walk through a realistic scenario with a fictional 10-unit multifamily building we'll call "The Maplewood Apartments."
Building the Gross Annual Income
First things first, you need the rent roll. Think of it as the property's financial heartbeat, a simple list showing every unit and what it's generating in rent each month.
Let's say the rent roll for The Maplewood Apartments breaks down like this:
- 5 units @ $1,500 per month
- 5 units @ $1,600 per month
To start, we figure out the total monthly haul. The first five units bring in $7,500 ($1,500 x 5), and the other five bring in $8,000 ($1,600 x 5). Add them up, and you get a total monthly gross rent of $15,500.
Now, to get the annual number, just multiply that by twelve.
$15,500 (Monthly Rent) x 12 (Months) = $186,000 (Gross Annual Rent)
That $186,000 is the engine of our GRM calculation. It represents the property’s total potential income for the year, long before we even think about subtracting expenses.
Finalizing the GRM Calculation
The next piece of the puzzle is the property's price. For this deal, let's assume you've negotiated a sale price of $1,500,000 for The Maplewood Apartments. Now we have everything we need.
We just plug our numbers into the formula:
$1,500,000 (Property Price) ÷ $186,000 (Gross Annual Rent) = 8.06 GRM
The Gross Rent Multiplier is 8.06. On its own, that number doesn't mean much. But it becomes a powerful benchmark when you compare it to other similar properties in the area. If you find out that comparable buildings are trading at a GRM of 9 or 10, then The Maplewood's 8.06 might signal a pretty good deal.
Here’s a rookie mistake to avoid: never use the seller's initial asking price for this calculation. Asking prices are often aspirational, not realistic. For a truly accurate GRM, you need a solid handle on the property's actual market value or, ideally, the final sale price. This is where understanding how to accurately determine fair market value is so crucial. Always ground your calculations in real numbers to get a true picture of the investment.
Using GRM for Faster Multifamily Underwriting
Calculating the Gross Rent Multiplier for a single property is simple enough. But what happens when you’re looking at a pipeline of ten, twenty, or even fifty potential deals? Suddenly, that simple calculation becomes a serious bottleneck.
The old way of doing things, manually punching numbers from a rent roll or T12 into your underwriting model, is not just slow. It’s a breeding ground for human error. One misplaced decimal or transposed number can completely wreck your analysis, sending you down a rabbit hole on a deal that was never worth your time in the first place.
Automating the First Pass
This is where technology changes the game. Instead of acting like a data entry clerk, you can use smart tools to automate that critical first screening process. Imagine getting a dozen offering memorandums and having the GRM calculated for every single one in minutes.
Modern software built for multifamily analysis can instantly read and pull data from key documents. Here's a practical look at how it works:
- Automated Rent Roll Input: The software scans the rent roll, identifies each unit's rent, and adds it all up to get your gross annual income. You don't have to touch a calculator.
- T12 Financial Data Extraction: It does the same thing with the Trailing 12 Months (T12) financial statement, pulling the total revenue figures needed for the calculation directly into your model.
This automated first pass isn't just about speed. It's about building a system. By instantly calculating the GRM for every deal that crosses your desk, you create a consistent, data driven filter that immediately separates the good from the bad.
By getting rid of manual data entry, you remove one of the biggest sources of error in preliminary underwriting. This lets you trust your initial numbers and make faster, more confident decisions about which properties deserve a deeper look.
From Data Entry to Due Diligence
Once the machine handles the grunt work, your role shifts from number cruncher to strategic analyst. You’re no longer bogged down in spreadsheets. Instead, your time is freed up for what actually matters: digging into the details and conducting thorough due diligence.
You can quickly toss out the duds, those properties with a GRM way outside the market's norms, and focus all your energy on the deals that show real promise. This efficiency is a massive competitive advantage. While other investors are still fumbling with their spreadsheets, you’re already on the phone with brokers, scheduling site visits, and getting ahead on the most promising opportunities.
This shift is key to scaling your investment operations. Learning how to move from raw data to smart decisions is a core skill, and you can explore more on how to approach multifamily real estate underwriting turning data into decisions to build a more robust process. Automation handles the repetitive stuff, letting you focus on the high value work that actually closes deals. It’s not about replacing your judgment. It’s about empowering it with clean, fast, and reliable data.
Understanding the Pros and Cons of GRM
No single metric tells the whole story of a property, and the Gross Rent Multiplier is a perfect example. Its greatest strength is its beautiful simplicity. When you need to quickly compare a handful of similar properties in the same neighborhood, GRM is your best friend.
This speed makes it an ideal first pass filter. You can size up a deal without getting bogged down in complex spreadsheets, saving your deep analysis for properties that actually make sense on the surface.
The Power of Simplicity
The main advantage of using the GRM is how straightforward it is. You only need two numbers, the price and the gross annual rent, to get an instant read on a property's valuation relative to its income.
This lets you:
- Quickly Compare Deals: Line up multiple listings in a short amount of time to see how they stack up against each other.
- Gauge Market Pricing: See if a property's GRM aligns with the local market average, helping you spot potentially overpriced or undervalued assets.
- Screen Opportunities Efficiently: Eliminate properties that are clear outliers without wasting hours on a full underwriting process.
This infographic shows a side by side GRM comparison for two different properties.
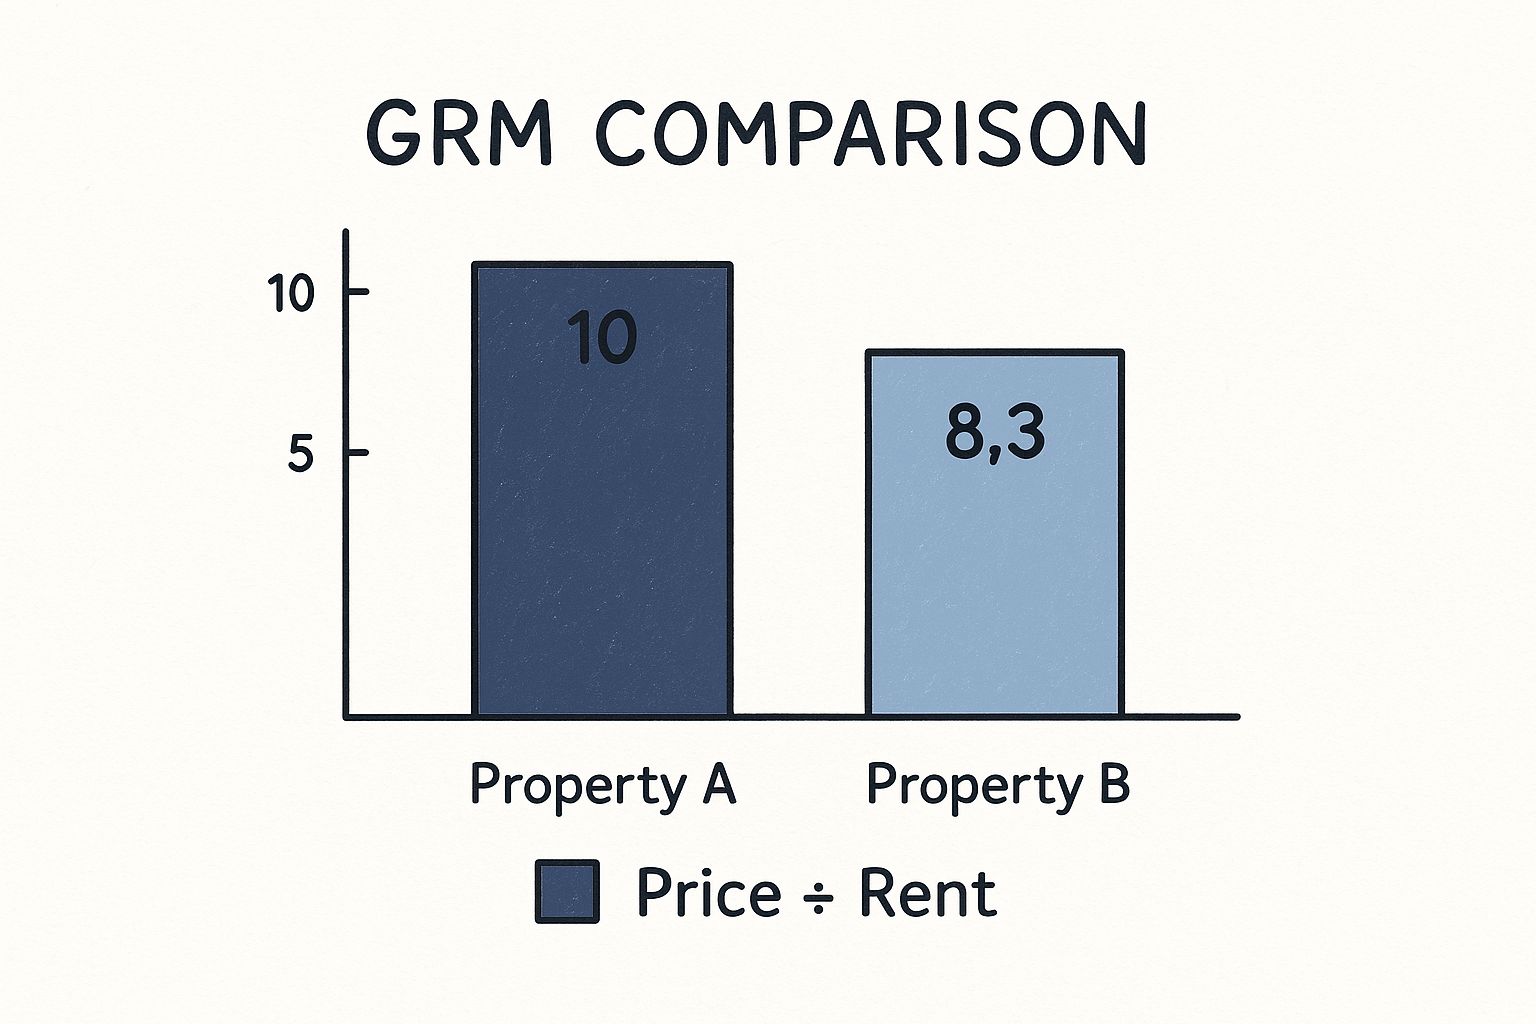
Based on GRM alone, Property B looks like the better deal with a lower multiplier. But this is where the story gets more interesting.
The Big Blind Spot: Operating Expenses
Here’s the catch: GRM’s simplicity is also its biggest weakness. By focusing only on gross income, it completely ignores every single operating expense. This is a massive blind spot that can lead you astray if you're not careful.
Two properties can have the exact same GRM but wildly different financial outcomes. One might be a newer build with low maintenance costs, while the other is an older building bleeding money on repairs, taxes, and insurance. The GRM sees them as identical.
A low GRM might seem attractive, but it could be hiding sky high operating costs. This is why GRM should be treated as a starting point for your analysis, never the finish line.
Let’s revisit our two properties with some added context.
| Metric | Property A | Property B |
|---|---|---|
| Purchase Price | $200,000 | $150,000 |
| Gross Annual Rent | $20,000 | $18,000 |
| GRM | 10 | 8.3 |
| Annual Expenses | $5,000 | $9,000 |
| Net Operating Income | $15,000 | $9,000 |
Suddenly, the picture changes completely. Property B, with its lower GRM, has much higher expenses, leaving less cash in your pocket at the end of the day. Property A, despite its higher GRM, is actually the more profitable investment once you look past the gross numbers.
This simple example proves that while GRM is a useful tool for a quick glance, it can't replace a thorough look at a property's real world expenses. Recognizing these nuances is key, and you can learn more about avoiding common pitfalls in multifamily property investment analysis to sharpen your skills.
Why a Good GRM Is Different Everywhere
If you’re hunting for a single magic number that defines a “good” Gross Rent Multiplier, you’ll be looking forever. There isn’t one.
A GRM of 12 might be an absolute steal in a high growth coastal city, while that same number could be a terrible deal in a slow and steady Midwest town. The metric is completely dependent on its surroundings.
A property’s GRM is really a reflection of market confidence. It tells a story about how other investors feel about an area's future. A high GRM often signals strong optimism, where buyers are willing to pay more for each dollar of rent because they expect property values and rental income to climb.
Reading the Market's Temperature
On the other hand, a lower GRM can sometimes point to higher perceived risk. Investors in these markets might demand a quicker payback on their investment through rents because they aren't as confident in long term appreciation.
This is why a GRM of 7 in one city and 11 in another can both represent fair market value. It all comes down to context.
Think of it like this:
- High GRM (e.g., 10-14): Often found in booming markets with strong job growth and population influx. Investors are paying a premium, betting on future appreciation.
- Low GRM (e.g., 6-9): More common in stable or slower growing markets. The appeal here is often stronger immediate cash flow relative to the purchase price.
This relationship between price, rent, and market sentiment has been visible for decades. What’s considered a normal GRM has shifted with economic tides. Data from the 90s and early 2000s shows residential GRMs often sat between 8 and 12, but they dipped below 6 in many places after the 2008 financial crisis as property values fell.
By 2021, those numbers rebounded, with averages hitting 10–14 in coastal hubs and 7–10 in Sun Belt cities. You can find more historical data about the evolution of Gross Rent Multiplier and how it changes over time.
The key takeaway is that GRM isn't a universal yardstick. It’s a local dialect. You have to understand what’s considered normal for a specific city, neighborhood, and even property type to interpret it correctly.
Before deciding if a GRM is good or bad, you must first establish a baseline. The best way to do this is to analyze recent, comparable sales in your target area. By calculating the GRM for a handful of similar properties that have recently sold, you create your own market specific benchmark. This context is what transforms the GRM from just a number into a truly useful analytical tool.
Putting It All Together with Other Key Metrics
Using the Gross Rent Multiplier is like having a quick conversation to see if you and a property are a good fit. It’s a fantastic first step, but a lasting investment relationship needs a much deeper understanding.
To get the full story on a deal, you need to bring in other key metrics that look beyond just gross income. Think of your analysis as a toolkit. The GRM is the tape measure you use for a quick size up. Now it's time to pull out the more specialized tools to see if the foundation is solid and the investment thesis holds up.
The Capitalization Rate
The most common partner to the GRM is the Capitalization Rate, or Cap Rate. While they might sound similar, they tell very different stories. The GRM is all about the top line, gross income, but the Cap Rate dives one level deeper by focusing on profitability after expenses.
The cap rate is based on net operating income (NOI), expressed as a percentage of the property's value. For example, a property worth $500,000 with $40,000 in NOI has an 8% cap rate. GRM's simplicity is great for a rapid comparison, but it can easily hide major cost differences between properties. You can explore more about how these two metrics work in commercial real estate.
Beyond Cap Rate: Other Important Metrics
While Cap Rate is crucial, a truly solid analysis includes a few other viewpoints. Each one answers a different, vital question about the investment's performance.
- Cash-on-Cash Return: This metric is intensely practical. It tells you the direct return on your down payment and closing costs by measuring the annual pre tax cash flow you receive relative to the actual cash you invested.
- Internal Rate of Return (IRR): This is a more advanced metric that looks at the big picture. IRR calculates the total long term profitability of an investment over its entire holding period, accounting for the time value of money.
Layering these metrics gives you a multi dimensional view of a deal. GRM screens for value, Cap Rate checks profitability, Cash on Cash measures immediate returns, and IRR projects long term performance.
By using these tools together, you move from a simple screening to a full fledged analysis. This comprehensive approach is central to professional grade underwriting. For a deeper look at this process, check out our complete guide to multifamily real estate underwriting. Combining these metrics is how you build a powerful, data backed case for any acquisition.
Common Questions About the Gross Rent Multiplier
Jumping into any new real estate metric is going to bring up some questions. Let's walk through a few of the most common ones investors have when they first start using the Gross Rent Multiplier.
What Is a Good GRM for a Rental Property?
This is the million dollar question, and the honest answer is: it depends entirely on the market. There's no magic number that works everywhere.
A GRM between 4 and 7 might be a fantastic deal in one city, while a GRM of 10 or 12 could be an absolute steal in a high growth coastal market. The trick isn't to find a universal "good" number, but to figure out what's typical for the specific neighborhood you're looking at. The only way to do that is to compare your target property's GRM to similar buildings that have sold recently in the same area. That's your benchmark.
What's the Difference Between GRM and Cap Rate?
The single biggest difference comes down to one word: expenses.
The Gross Rent Multiplier is a blunt instrument. It only looks at the gross annual rent and completely ignores every single operating cost, things like property taxes, insurance, repairs, and management fees. The Cap Rate, on the other hand, is built on Net Operating Income (NOI), which is the income left after you've paid all those expenses.
Think of it this way: GRM is for a quick first glance to see if a deal is even in the right ballpark. A Cap Rate gives you a much sharper, more realistic picture of a property's actual profitability.
How Should a New Investor Use GRM?
For someone new to the game, the GRM is the perfect first pass filter. It's your best friend when you're staring at a list of 50 potential deals and don't know where to start.
Calculate the GRM for every property on your list. This quick math lets you immediately toss out the deals that are obviously overpriced compared to everything else in the area. It saves you from wasting hours, or even days, doing a deep dive on a property that was never going to make financial sense in the first place.
Ready to stop wasting time on manual data entry and underwrite more deals? QuickData.ai offers an AI-powered Excel add-in that automates data extraction from rent rolls and T12s directly into your models. Start your 14-day free trial and see how much faster your analysis can be at https://quickdata.ai.
Article created using Outrank