Multifamily Real Estate Underwriting: Turning Data into Decisions
The Foundation of Successful CRE Investment
The multifamily real estate market remains a compelling investment opportunity, attracting substantial capital from investors worldwide. Yet today’s market environment—marked by economic volatility and changing tenant preferences—demands more than gut instinct or reactive decision-making. Successful investors distinguish themselves through proactive, data-driven strategies. For those seeking sustainable, risk-adjusted returns, the path to success begins long before closing day—it starts with getting the purchase price right through comprehensive underwriting.
What Is Underwriting and Why Does It Matter?
Underwriting is the systematic process of evaluating a multifamily property’s financial potential and risks. It examines every aspect of the investment: revenue generation capacity, operating costs, market dynamics, and potential pitfalls. For lenders, this process validates whether both the property and borrower represent a sound lending opportunity. The objective is clear: determine if the property can produce enough income to cover all expenses, service debt, meet capital requirements, and deliver targeted investor returns.
This evaluation translates raw data into actionable insights about risk versus reward—accounting for market volatility, operational challenges, and leverage considerations. Precise underwriting doesn’t just forecast profits; it identifies weaknesses and helps prevent losses or loan defaults.
The complexity stems from synthesizing numerous data sources: financial records, rent rolls, market comparables, financing terms, tax obligations, insurance requirements, future projections, and property conditions. Traditional manual methods are time-intensive, error-prone, and often too slow for today’s competitive marketplace.
Excellence requires systematic, measurable approaches. Leading investors employ standardized processes and objective data analysis across all deals. This methodology minimizes bias, enables fair comparisons between opportunities, and produces more dependable investment decisions. Let’s examine the essential elements of multifamily underwriting, their analysis requirements, interconnections, and how technology transforms data into strategic insights.
Breaking Down a Multifamily Investment: Essential Components
Effective underwriting dissects properties into core financial and operational elements. Each component demands rigorous analysis and verification to reveal true investment potential and risks.
Starting Point: Historical Financial Performance (T12/Operating Statements)
A property’s recent financial track record provides the crucial baseline for analysis. The Trailing 12-month (T12) statement reveals actual revenue and expenses from the past year, establishing the foundation for calculating Net Operating Income (NOI)—the key profitability metric before debt and capital investments.
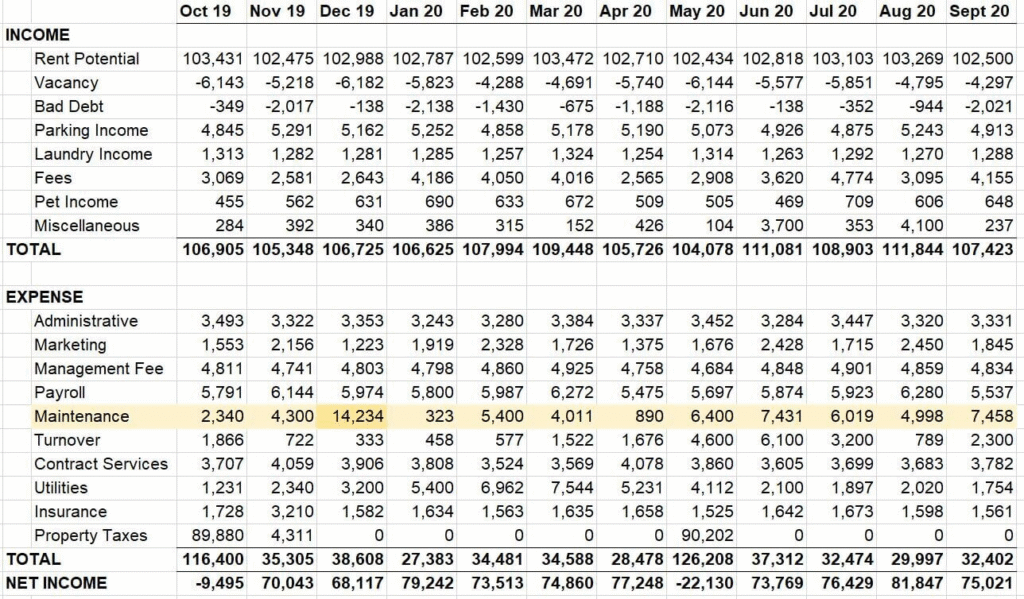
Best practice involves obtaining detailed monthly statements, not just annual summaries. Three years of operating history helps identify patterns, unusual events, and performance variations. The analysis examines:
Revenue Analysis: Review all income sources systematically. Begin with Gross Potential Rent (GPR), then subtract vacancy losses, credit losses, and concessions. Examine ancillary income: laundry facilities, parking charges, pet fees, application fees, late payments, utility reimbursements, and storage units. Comparing collections to potential rent indicates operational effectiveness. Trend analysis—like comparing annualized Trailing 3-month (T3) income to T12 figures—reveals recent momentum shifts.
Expense Review: Categorize and scrutinize all operating costs. Fixed expenses (property taxes, insurance) change infrequently, while variable costs (utilities, repairs, turnovers, landscaping, payroll, management fees, administration, marketing) fluctuate regularly. Calculate expense ratios and benchmark against similar properties to assess efficiency. Identify and adjust for one-time expenses to establish normalized projections.
NOI Determination: Calculate using: Gross Potential Rent minus Vacancy & Credit Loss equals Effective Gross Income (EGI). Then EGI minus Total Operating Expenses equals NOI.
Monthly data reveals insights annual figures hide: seasonal patterns, timing of major repairs, and performance trends. This detail enables informed future assumptions and highlights areas requiring seller clarification—unexplained monthly variations, documentation discrepancies, or vague line items signal deeper investigation needs.
Challenges include obtaining organized, complete records—particularly from smaller operators—and ensuring capital improvements aren’t misclassified as operating expenses, which would understate historical NOI.
Real-Time Position: Rent Roll Evaluation
The rent roll provides current occupancy details, tenant composition, and revenue streams—the primary document for income verification and future projections.
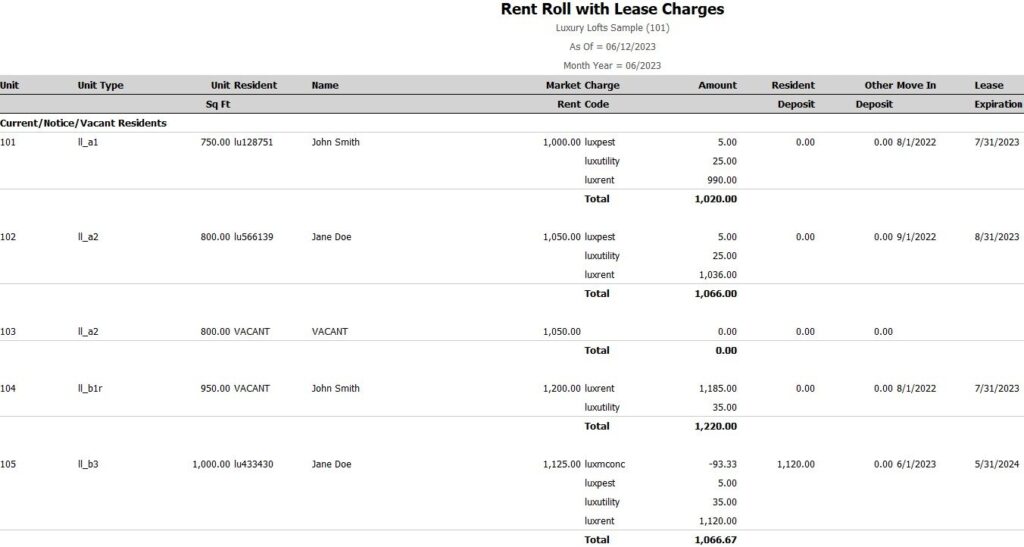
Comprehensive rent rolls include: tenant names, unit details, square footage, lease dates, move-in dates, current rent, market rent estimates, concessions, deposits, additional charges, and occupancy status. Direct exports from property management systems (Yardi, RealPage, Entrata, AppFolio) ensure accuracy.
Key analysis areas:
Income Validation: Monthly scheduled rent should match recent T12 statements. Account for concessions reducing effective rent. Calculate “loss-to-lease”—the gap between current and market rents—indicating potential upside.
Occupancy Metrics: Determine physical occupancy and economic vacancy. Analyze turnover patterns using move-in/out dates to understand leasing momentum.
Lease Expiration Analysis: Map upcoming expirations over 12-24 months. Concentrated expirations, especially during slow seasons, create rollover risk and turnover costs. Analyze both unit counts and revenue impact.
Tenant Stability: Long tenancy suggests property stability but may indicate below-market rents. High turnover might signal problems or market characteristics, but creates renovation and rent adjustment opportunities.
Unit Type Performance: Compare performance across different floor plans to identify strengths and weaknesses.
Move-in dates specifically show current market acceptance—new tenant rents reflect today’s market reality better than renewal rates, validating proforma assumptions.
The expiration schedule represents both risk and opportunity. Peak season expirations facilitate value-add execution through strategic renovations and rent increases.
Challenges include obtaining accurate, complete data and efficiently processing large datasets manually.
Market Context: The Importance of Comparables
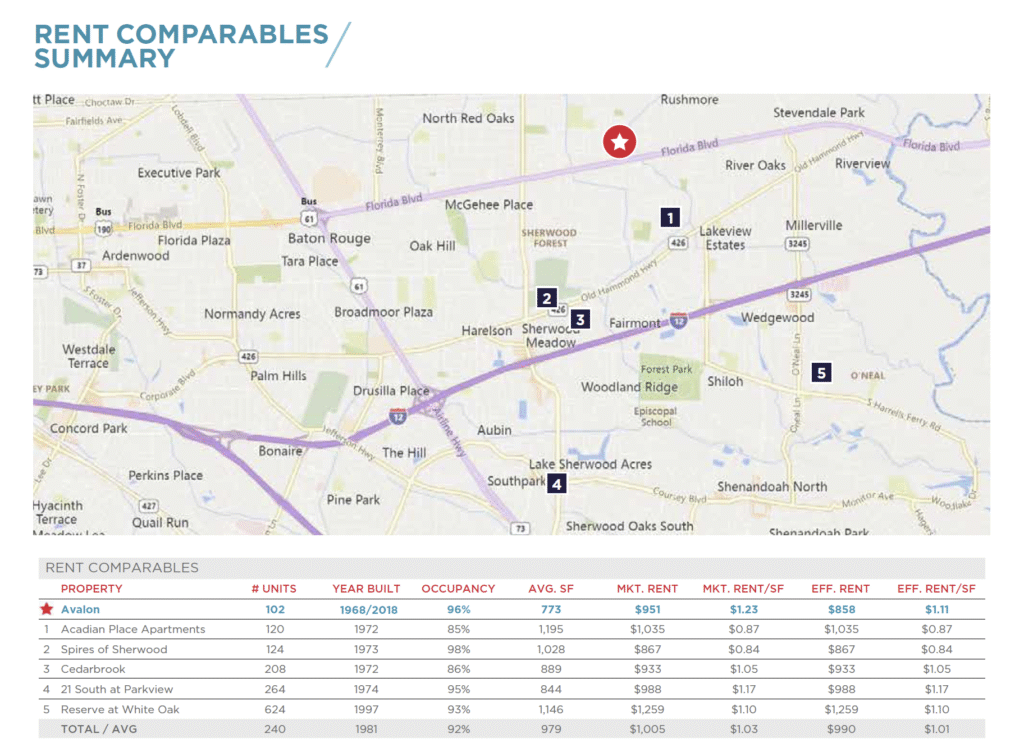
Properties don’t operate in isolation. Comparable analysis benchmarks performance and potential against market realities, validating assumptions for rents, expenses, and valuations.
Rent Comparables: Compare subject property rents to similar nearby properties (1-3 mile radius). Match unit types, sizes, and conditions. Adjust for amenities, finishes, utilities, parking, and concessions. Analyze both per-unit and per-square-foot metrics. Effective rents (after concessions) provide truer comparisons than asking rents.
Sales Comparables: Estimate market value using recent comparable sales. Key metrics: price per unit, price per square foot, and implied cap rates. Adjust for location, age, size, condition, amenities, and financing terms.
Expense Comparables: Benchmark operating costs per unit against similar properties. Identifies inefficiencies and validates projections. Building proprietary databases enhances future analysis.
Data sources vary in reliability:
- Brokers provide local insights but may curate information
- Online platforms show current listings but primarily asking rents
- Paid services (CoStar, REIS) offer broad coverage at significant cost
- Public records confirm transactions but may lack pricing details
- Appraisers provide verified analysis
- Internal databases create valuable proprietary resources
Effective analysis requires multiple source verification and understanding ranges, not just averages. Consider market tiers and where the subject property fits. Remember that capital market conditions influence sales comparables—historical cap rates need context adjustment.
Critical Cash Flows: Debt, Taxes & Insurance
These major expenses directly impact returns and require precise estimation.
Financing Structure: Loan terms powerfully influence returns. Key factors: loan amount (LTV/LTC ratios), interest rates (fixed/floating), amortization, term length, fees, and special features. Obtain current quotes from multiple lenders. Understand DSCR requirements—typically 1.20x minimum. Incorporate daily rate updates for accuracy.
Property Taxes: Often 15-45% of operating expenses. Verify current liability and project reassessment risk upon sale. Research local procedures, as methodologies vary significantly. New purchase prices frequently trigger substantial tax increases—project accordingly using specific growth rates.
Insurance Coverage: Required protection varies by location, building condition, and market cycles. Obtain property-specific quotes accounting for new ownership and lender requirements.
Tax reassessment represents a major risk—failing to project post-acquisition increases overstates NOI and underestimates expenses. Similarly, floating-rate loans require forward curve modeling, not static rate assumptions.
Future Performance: Market Projections
While historical data provides foundation, underwriting projects future performance through informed assumptions:
Rent Growth: Base projections on submarket supply/demand, economic trends, and comparable performance. Avoid unrealistic straight-line assumptions. Consider affordability limits and seasonal patterns. Conservative early-year assumptions prevent compounding errors.
Occupancy Projections: Factor historical rates, submarket conditions, new supply, and planned improvements. Account for both physical and economic vacancy.
Expense Inflation: Apply appropriate growth rates—some items like taxes may exceed general inflation.
Exit Cap Rates: Critical for estimating sale value. Conservative approach assumes higher exit than entry cap rates, providing market cushion.
Support assumptions with thorough research and sensitivity analysis. Model multiple scenarios to understand variable impacts on returns. Remember: early projection years disproportionately affect final valuations.
Creating Value: Renovation Strategy Analysis
Value-add strategies require analyzing improvement potential beyond current conditions:
Opportunity Assessment: Identify upgrades commanding market premiums based on comparable evidence.
Cost Planning: Develop detailed budgets including contingencies. Involve construction professionals for accuracy.
Rent Premium Validation: Base projections on verified comparable renovations, not optimistic assumptions.
Implementation Planning: Coordinate with lease expirations to minimize vacancy. Model construction timelines realistically.
Return Calculation: Measure yield on cost: (NOI Increase / Renovation Cost).
Funding Strategy: Determine financing through equity or construction loans.
Success requires integrating costs, achievable premiums, and execution planning. Major system replacements may also reduce future maintenance expenses, enhancing NOI beyond rent increases.
Traditional Underwriting Challenges
Manual processes create significant obstacles:
- Data collection from multiple sources becomes chaotic
- Manual entry invites errors and consumes time
- Inconsistent formats require extensive standardization
- Spreadsheet complexity hinders scenario analysis
- Comparable data management remains fragmented
- Team collaboration suffers from version control issues
These inefficiencies cost more than time—they represent missed opportunities and increased error risk. In competitive markets, slow analysis means losing deals. Manual processes multiply failure points where single errors cascade into flawed decisions.
Modern Solutions: Technology-Enabled Underwriting
If you’re underwriting multifamily real estate in Excel, tools like QuickData.AI automate rent roll and T12 data extraction from Excel and PDF docs directly into your financial model.
Automated Extraction: The QuickData Excel Add-In parses rent rolls and T12 statements directly from uploaded files, eliminating manual entry while handling complex properties efficiently.
This transformation represents the future of multifamily underwriting—where technology amplifies human expertise to produce faster, more accurate investment decisions. By automating routine tasks, professionals focus on strategic analysis and relationship building, ultimately driving better investment outcomes in an increasingly competitive marketplace.